In my first article, the theme was getting rid of named concepts from science. In this, my second article, the theme is balancing concepts and data and making sure that the number of the first does not exceed the number of the second. The reader will find that the two themes amount to the same thing, and that they reinforce each other. Neither theme is new. The first is based on a proposal of George Berkeley in 1710 and the second on the 14th century Occam’s Razor.
Scientist’s science
There are two kinds of science and the official one, traditional science, which I call ‘scientists’ science’, is the wrong one. It is obviously wrong because it can not explain one of the most obvious facts about our world, that we have instant access to views of far away stars. Go out on a starry night and look at a prominent star like Betelgeuse. Then turn your head away and after a moment or two, look back at Betelgeuse. Can you tell how long it takes for the image to re-form? Of course you can’t; it is too fast, essentially instantaneous. Scientists ask you to believe that it takes light 640 years to bring an image of the star Betelgeuse to you across space. That is obviously untrue.
Scientists’ science is wrong for another reason. It always uses more concepts than there are data and that means that it inserts its conclusions with its concepts.
Scientists’ science is created by scientists, for scientists, and located by scientists in ‘the present’, which scientists say, is a short-lived interval between past and future. After an extremely short lifetime (no-one knows how short)- a present is absorbed, they say, into the past and a new present peels off the future, serves for a brief moment and then is absorbed into the past and succeeded by another present. These presents, scientists say, are not visible because the light-waves that, scientists tell us, carry our sight, travel, they say, at a finite speed through space and time, time being a collective name for the succession of presents. The past, they say, is just like the present, but earlier. It is a stack of previous presents.
There is no evidence to back any of this stuff up. None. How couuld there be when it is a description of what can not be seen. How do scientists know all these things then? The answer is they don’t but they have taken on the task of assembling a mixture of ancient ideas like time and speed into an internally self-consistent logical structure and scientists’ science with its superabundance of named concepts is the result. The ideas have various origins. Primitive creatures like dinosaurs probably had concepts of time and distance so the whole rag-bag may be called dinosaur science, though it is usually dignified by the name traditional science. Einstein invented two new concepts, the constant speed of light and time dilation, in his 1905 theory of relativity. Since then, there have been many more. They multiply like rabbits.
There are no data in the present because it can not be seen so scientists use their idea that the past is just like the imagined present, to justify explaining the real data of the past with the rag bag of ideas in dinosaur science. The attempt fails because the real past is nothing at all like their version of the unseen present.
When scientists find that data are not like their version of the present they change the data.
As everyone knows, changing data to fit a theory is the ultimate scientific crime. In traditional science though, everybody does it so it is institutionalised and no longer considered to be a crime. They call data, ‘raw data’, until they have ‘corrected it for the speed of light’.
If you see an airliner crossing the sky, that is a set of data. A scientist though will tell you that the airliner is not where you see it to be because the image you see left the airliner a few tens of nanoseconds ago and since that time the airliner has moved a few feet further. With a few sums, he will even tell you where it is in the unobservable present. That is ‘correcting for the finite speed of light’. It is anti-science rather than science.
All scientists should count the number of data in a data diagram and refuse to accept explanations with more concepts than data. Scientists’ science would then vanish.
Types of Axes
Fig 1(a) shows that because scientists’ science has two kinds of axes, time and distance. it routinely uses three concepts, time, distance and speed. Nature’s science has only one kind of axis defined by the directions in which we see in the 4-d past. Having only one kind of axis it requires only one concept for measurements along those directions.

Fig 1: Scientists imagine a world like (a) but the real world is like (b).
Nature’s science
The crucial difference between scientists’ science and nature’s science is in the directions we see. In scientists’ science it is assumed that the directions in which we see are the directions N, S, E, W, Up and Down and directions between, like NW and SE. Those are the directions of fig 1(a).
In nature’s science, the directions in which we see are N-past, S-past, E-past, W-past, Up-past and Down-past, and directions in between. Those are the directions of fig 1(b). They form a cone in the 4-d past, which may be called the sight cone. Two opposing directions, like N-past and S-past are inclined to each other at 90 degrees and so form a square coordinate grid which enables points on a 2-dimensional plane in the 4-d past to be assigned geometrical coordinates, instead of the time and distance coordinates of scientists’ science.

Fig 2: A two-dimensional plane in the 4-d past has two similar axes and a square coordinate grid. Y sees X’s image at B and X sees Y’s image at A.
Science and clocks
In scientists’ science, clocks are assumed to measure intervals along the time axis of fig 1(a). In reality they measure relative coordinates in the 4-d past as in fig 2. Clocks are surveying instruments like theodolites and measuring tapes. They measure the geometry of the 4-d past. Seconds and metres are both geometrical units and a second is the same as 300 million metres. The data of a geometrical world are instantly accessible, as we observe in viewing the stars and planets.
All of this is clearly illustrated in the following example.
The measurements on Jupiter in 1676.
In 1676, a very famous series of observations on the Planet Jupiter used the repetitive orbits of one of Jupiter’s satellites as an astronomical clock and found that the Jupiter clock loses 1000 seconds on a terrestrial clock during the six months that Earth moves away from Jupiter and regains the 1000 seconds during the following six months as Earth approaches Jupiter.
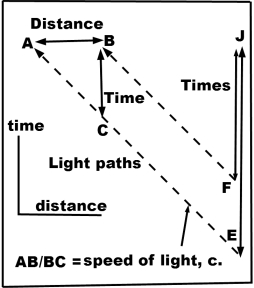
Fig 3: The scientists’ science explanation of the observations of 1676 leads to the conclusion that the speed of light is 300 million metres per second.
Fig 3 is the data diagram as it is labelled by scientists. They draw a time and distance diagram with the distance axis from side to side and the time axis from bottom to top, like fig 1(a). B and A are positions of the Earth at the points on its orbit when it is nearest to Jupiter and furthest from Jupiter. AB is identified as the diameter of Earth’s orbit round the sun, 186 million miles. EA and FB are identified as the paths of light which carry Jupiter’s images to Earth when they are furthest apart and closest together. EJ and FJ are the flight times of the light in those circumstances. The 1000 seconds of time is identified with the difference, (FE-BC) between those flight times. Scientists conclude that the speed of light is 186 million miles per 1000 seconds or 186000 miles per second. That conclusion has been inserted into the diagram by using three concepts to describe one datum.
Fig 3 is the nature’s science explanation. In nature’s science, an observer at A thinks he is looking at B in the present but the direction in which he sees is tilted 45 degrees towards the past so he sees an image of B at C and an image of Jupiter at G. He measures along AG. Six months later, he is at B and measures along BF. The single datum is AG-BF=AC.
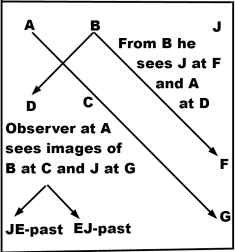
Fig 4: Nature’s science explanation of the 1667 observations leads to the conclusion that one second and 300 million metres are the same.
The single datum is identified with 1000 seconds and also with the 186 million miles obtained by triangulation measurements. It is concluded that 186 million miles and 1000 seconds are the same and 186000 miles is the same as one second. The constant c is only a ratio between the units of two measuring instruments. Experiments which are claimed to measure the speed of light only measure the number of metres in a second or the number of miles in a second.
The speed of light does not exist. It is introduced into scientists’ science to provide explanations compatible with ideas based on the dinosaur concepts of time and distance. If scientists counted concepts and data there would be no problems with dinosaur science.
The past seen in mirrors.
The images of the past seen when standing between two mirrors are known to all.

Fig 5: A sketch of a photograph taken into one of a pair of parallel mirrors.
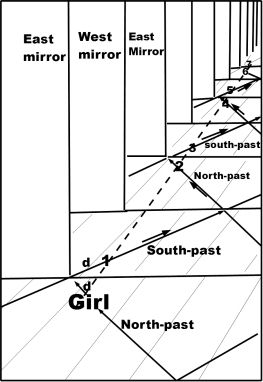
Fig 6 adds a network of sight lines to fig 5 to explain the location of the images.
Fig 5 is a sketch of a photograph on the web (see references). Two mirrors face each other across a corridor and a girl is sitting on the floor looking at her images, 1 2, 3, 4 etc. The images lie at the intersections of a zig-zag sightline and the girl’s image line. The zig-zag alternates between the directions North-past and South-past, the direction changes occurring at the mirrors. The broken line is the girl’s image line.
Sightlines in the past pass through mirrors. At every direction change, the zigzag turns towards the past. In figs 3 and 4, one looks through a series of mirrors at a series of views of the corridor, each view being one unit deeper in the past than the preceding view and one unit less deep than the succeeding one.
Fig 7 shows how the diagram can be used to represent Galileo’s Pisa experiment without concepts of time, distance and speed.
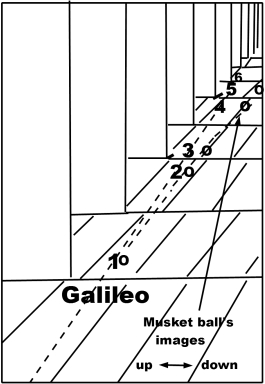
Fig 7. A representation of Galileo’s Pisa experiment.
In fig 7, Galileo clings to the side of a lift shaft down which he has just dropped a musket ball. The ball’s image line curves away from G’s image line and when G’s straight image line is N units long, the ball’s image line is n units from it. By equating n/N, to (1/2)gN one obtains a parameter g, as a measure of the strength of the Earth’s gravity at the Earth’s surface. In scientists’ science the equation appears as s=(1/2)gt2 where s is a distance. g an acceleration and t a time. Again, there are more concepts than there are data.
Fig 8 shows the data diagram.
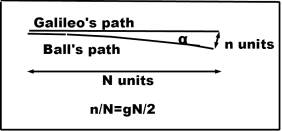
Fig 8: A data diagram in the past.
Galileo’s image line is in the direction (Np+Sp), a combination of North-past and South-past. The perpendicular direction in which the musket ball moves is (Np-Sp). There is no speed in fig 8 because it is in the past Everything has already happened. Instead, there is a concept of angle of divergence of two image lines. In fig 6, n/N is equal to sin(a) so what in scientists’ science would be described as a relative speed, or velocity, v, is in nature’s science the sine of an angle of divergence
Einstein’s mistake
In 1905, Einstein studied the data of the relativistic Doppler Effect and attributed equations relating the sines of three angles of divergence, concepts of nature’s science, to three relative speeds, concepts of scientists’ science.

Fig 9: Three angles of divergence with Doppler parameters D and sines S.
The three values of the divergence parameter, also known as the Doppler parameter, D, are related by 3=2×3/2 and that causes the three values of S to be related by equations which Einstein used to describe the relation between three speeds in scientists’ science. The result is that whenever Einstein uses v/c to mean a relative speed divided by the speed of light, it should be interpreted as the sine of an angle of divergence. From the misattributed equations he deduced that it is impossible for a relative speed to exceed the speed of light. With the correct attribution the equations only mean that the sine of an angle can not exceed 1, which we knew already.
A few years ago, scientists at CERN were briefly excited because they thought they had seen a particle with a speed greater than the speed of light. I waited confidently for the announcement that it had been a fault in the system, because I did not believe they had seen the sine of an angle greater than 1. If the CERN scientists had counted data they would have known that Einstein had made a mistake and that he had inserted his conclusion about speeds not exceeding the speed of light, with his concepts. .
By trawling through the history of science one can find lots of other examples where a conclusion has been inserted with concepts. Scientists are like artists using a brilliant palette of colours. Reality though is monochrome. A simple routine of counting data and concepts, brings science and scientists back from their many-coloured multi-concept psychodelic science to work-a-day reality.
I leave you with an interesting question. Is the Big Bang an unreal idea that has been inserted into science with the concepts of speed and time?
The next article will recount what happened in 1710 to George Berkeley’s attempt to persuade scientists to return to reality, the forerunner of this blog.
Goodbye for now and thank you for joining me.
Stan Clough 26.6.18
References
- Downing, Lisa, “George Berkeley”, The Stanford Encyclopedia of Philosophy (Spring 2013 Edition), Edward N. Zalta (ed.), URL = <https://plato.stanford.edu/archives/spr2013/entries/berkeley/>.
- “Rømer’s determination of the speed of light.” Wikipedia, The Free Encyclopedia. Wikipedia, The Free Encyclopedia, 29 Apr. 2018. Web. 26 Jun. 2018.
- Gbur, Gregory J. (July 30, 2011). “Infinity is weird… even in infinity mirrors!”. Skulls in the Stars:
